Mutational scanning in Drosophila
Curran Oi
Hundreds of millions of single nucleotide variants in the human genome have been identified by sequencing, with 5 million of these residing in protein-coding DNA. Despite this wealth of data, only ~2% of the coding variants have clinical annotations, half of which are “variants of uncertain significance.” How do we determine which variants are pathogenic and which are benign? We and others have developed high throughput methods for variant interpretation. One such method is deep mutational scanning, a massively parallel approach for screening a library that contains millions of single gene variants. This approach has proven useful in classifying variants of BRCA1, PTEN, and other human genes by carrying out screens in cell culture. While this approach has the benefit of scale, it does not enable mutations to be studied in a developmental or tissue-specific context. However, many human genetic diseases, including cancer, occur in a developmental or tissue-specific context. We are therefore developing approaches to assess variants in high throughput in the fly Drosophila melanogaster, which has orthologs for approximately 75% of human disease genes and is a powerful system for studying development and disease.
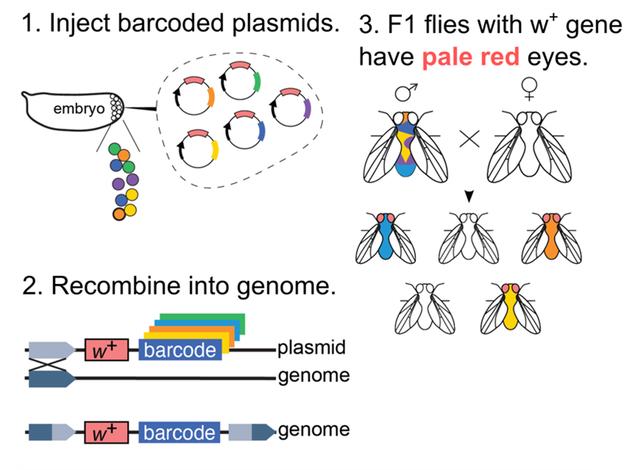
Figure 1. Approach for generating transgenic F1 flies. (1) To generate barcoded flies, we first inject a pooled plasmid library in which each plasmid contains an attB recombination site, a random 15 nt barcode, and a w+ marker (red eyes). (2) The injected flies express PhiC31 recombinase in their germ cells and the plasmids integrate into an attP site present in the fly genome. (3) The injected flies are mosaic in their germline, because different germ cells can integrate plasmids with different barcodes into their genome. We cross male flies mosaic in their germline to white eyed wildtype female flies. The resulting F1 flies will each contain either zero or one barcode, because they inherit a haploid gamete from the mosaic male parent. Transgenic F1 flies contain a w+ marker and can thus be identified by their pale red eyes. We sequence the F1 flies from each single cross to determine the number of unique genomic integration events that occurred in the parental mosaic male fly.
Multiplexed super-resolution imaging of genes
Curran Oi
The heat shock response is highly conserved across eukaryotes and critical for cell fitness. Moreover, cancer cells use the heat shock machinery to improve their robustness and virulence. Despite extensive study over 50 years, much remains unknown about the mechanism of heat shock response. Chromatin conformation capture and fixed cell imaging have shown that some genes upregulated during heat shock associate with one another during heat shock. This observation raises many important questions, including: How does heat shock reorganize the nucleus? How is this process coordinated across multiple genes? Are the interactions between genetic loci 1:1 or higher order? Are these interactions transient? And are the associated genes also bound to heat shock-related proteins?
To study nuclear reorganization of genes, we are adapting the LIVE-PAINT super-resolution imaging approach for labeling genes, as well as proteins. In LIVE-PAINT, a short peptide (1-5 kDa) is fused to a target protein and a peptide-binding protein is fused to a fluorescent protein and expressed separately. The fluorescent protein is transiently recruited to the target protein by this peptide-protein interaction. This binding event generates a “blink” that can be fit to a point spread function. Repeated binding events generate super-resolution localization events that are compiled to produce a super-resolution image.
To study nuclear reorganization of genes, we are adapting the LIVE-PAINT super-resolution imaging approach for labeling genes, as well as proteins. In LIVE-PAINT, a short peptide (1-5 kDa) is fused to a target protein and a peptide-binding protein is fused to a fluorescent protein and expressed separately. The fluorescent protein is transiently recruited to the target protein by this peptide-protein interaction. This binding event generates a “blink” that can be fit to a point spread function. Repeated binding events generate super-resolution localization events that are compiled to produce a super-resolution image.
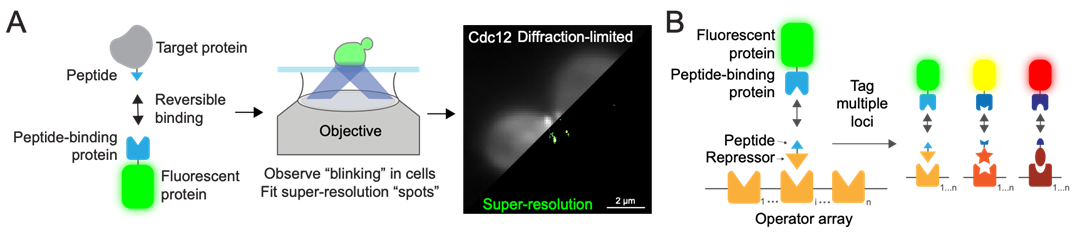
Figure 1. (A) LIVE-PAINT uses reversible peptide-protein interactions to transiently associate a fluorescent protein to a target protein. Diffraction-limited and super-resolution images of Cdc12 tagged and imaged in yeast are shown as an example. (B) LIVE-PAINT imaging of genes will be performed by integrating operator arrays (e.g. lacO) with n repeats near a gene of interest. The operator’s cognate repressor (LacI) will be expressed and fused to a peptide. Imaging is then performed as in (A).
To adapt this approach to visualize genes in live cells, we are integrating an operator array (e.g. lacO) with n repeats near a gene of interest. Then, we express the array’s cognate repressor protein (LacI) fused to a peptide and a peptide-binding protein fused to a fluorescent protein. Transient binding between the peptide and peptide-binding protein will generate super-resolution localizations at the gene of interest, just as in the original implementation of LIVE-PAINT.
We will then use LIVE-PAINT to visualize nuclear reorganization of genes during heat shock in yeast and distinguish between models of nuclear reorganization. We will utilize haploid, aneuploid, and diploid yeast to build a model for how genes associate during nuclear reorganization. Some possible models are outlined in the figure below.
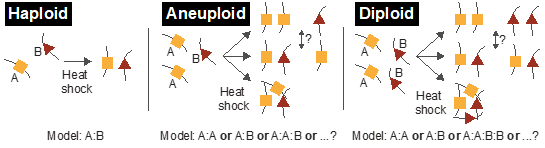
Figure 2. Two genes (A and B) that associate A:B in a haploid strain may prefer self-association A:A and B:B in aneuploid and diploid strains, or may all associate together (e.g. A:A:B:B).
Learning the grammar of plant regulatory DNA
Tobias Jores (in collaboration with the Queitsch/Cuperus lab
Faced with accelerating climate change and rapid population growth, we need crops with higher yields and greater resilience to ensure food security. Crop genome engineering will likely play an important role in meeting future food needs, and gene regulatory sequences are promising targets for crop improvements. However, we need to better understand plant gene regulatory elements and their interactions—the regulatory grammar—to enable their targeted manipulation.
To facilitate the genome-wide identification and characterization of active plant regulatory elements, we developed Plant STARR-seq, a massively parallel reporter assay that can detect the activity of many different cis-regulatory elements in plants (Figure 1). The plant STARR-seq assay can quantitatively determine condition-specific enhancer activity and identify the underlying functional sequence motifs by saturation mutagenesis at single-nucleotide resolution (Jores et al., 2020, doi: 10.1105/tpc.20.00155).
To facilitate the genome-wide identification and characterization of active plant regulatory elements, we developed Plant STARR-seq, a massively parallel reporter assay that can detect the activity of many different cis-regulatory elements in plants (Figure 1). The plant STARR-seq assay can quantitatively determine condition-specific enhancer activity and identify the underlying functional sequence motifs by saturation mutagenesis at single-nucleotide resolution (Jores et al., 2020, doi: 10.1105/tpc.20.00155).
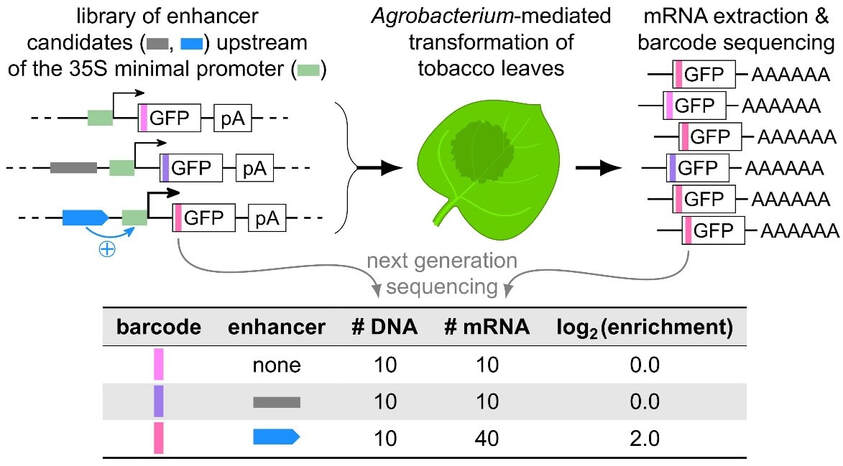
Figure 1: Plant STARR-seq: a massively parallel assay to study cis-regulatory elements in plants. Enhancer candidates are cloned directly upstream of a 35S minimal promoter. The candidate sequences are linked to a short barcode located in the GFP reporter gene. The pooled library of reporter constructs is used for transient transformation of tobacco leaves. After 2 days incubation, the reporter mRNA is extracted. Finally, the relative abundance of the barcode sequences in the input DNA and in the output RNA is determined by next generation sequencing. Since enhancers drive increased transcription, the enrichment of a linked barcode in the RNA relative to its DNA input is a measure of enhancer strength.
We have applied Plant STARR-seq to characterize plant core promotors. We array-synthesized the putative promoter regions of all Arabidopsis, maize and sorghum genes and measured their transcriptional activity by Plant STARR-seq. To compare promoter strengths across species, we tested all libraries in transiently transformed tobacco leaves and maize protoplasts. The promoters spanned a wide range of activity, with over 250-fold difference between the strongest and weakest promoters (Figure 2). Overall, the promoters of the dicot Arabidopsis tended to perform better in the dicot tobacco system, while the promoters of the monocots maize and sorghum showed greater activity in protoplasts of the monocot maize (Jores et al., 2021, doi: 10.1038/s41477-021-00932-y).
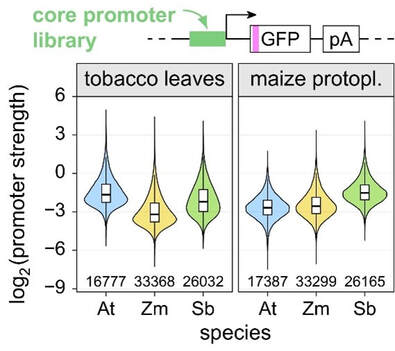
Figure 2: Plant core promoters span a wide range of activity. The activity of approximately 75,000 core promoters from Arabidopsis (At), maize (Zm) and sorghum (Sb) was measured by Plant STARR-seq in tobacco leaves and maize protoplasts.
We analyzed the sequences of the plant core promoters to identify the underlying elements that control their activity. We observed that core promoter elements, like the TATA-box, as well as promoter GC content and promoter-proximal transcription factor binding sites influence promoter strength. Using this data, we were able to design synthetic promoters that reach activities similar to the strong viral 35S minimal promoter by introducing core promoter elements into random sequences with a nucleotide composition optimized for the corresponding assay system (Figure 3A, B). Furthermore, the large-scale data enabled us to train convolutional neural network models that can accurately predict promoter strength, even of novel synthetic sequences. These predictive models were used for in silico evolution to increase the strength of over 200 weak, intermediate and strong core promoters, many of which exceeded the activity of the viral 35S minimal promoter after ten rounds of evolution (Figure 3C–E).
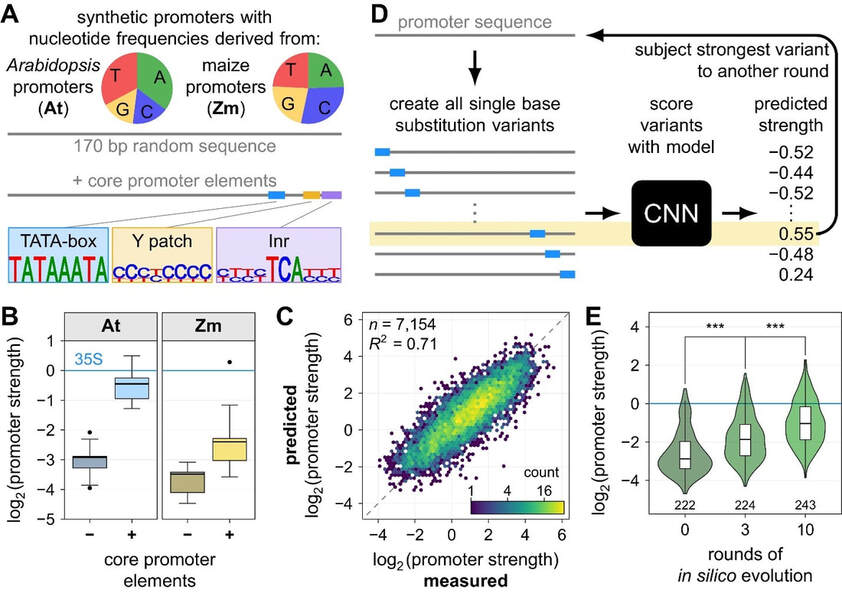
Figure 3: Rational and evolved designs of plant core promoters. A, Random sequences with nucleotide frequencies similar to average Arabidopsis or maize promoters were created and modified by adding three core promoter elements: a TATA box, Y patch and Inr element. B, Promoter strength of the synthetic promoters was measured by plant STARR-seq in tobacco leaves. C, A convolutional neural net model trained on STARR-seq data from tobacco leaves accurately predicts the activity of a held-out test set of promoters. D, Iterative in silico evolution of promoters. E, Plant STARR-seq experiments confirm that in silico evolution can increase promoter strength beyond that of the viral 35S promoter (blue line).
Currently, we are using Plant STARR-seq to identify potential enhancers—including light- and temperature-responsive ones—in plant genomes. Our work on core promoters revealed that condition-specific gene regulation is largely determined by transcription factor binding sites. Multiple such sites are often found in enhancers to control the condition- and tissue-specific expression of their target genes. Because enhancers recruit transcription factors to exert their function, they are likely to reside in accessible chromatin regions. We used published accessibility data to identify potential enhancers in Arabidopsis, tomato, maize and sorghum, selecting over 175,000 to analyze by Plant STARR-seq in the forward and reverse orientations. Using this library for Plant STARR-seq in tobacco leaves yielded highly reproducible measurements of enhancer strength with an over 1000-fold difference between the strongest and weakest sequences.
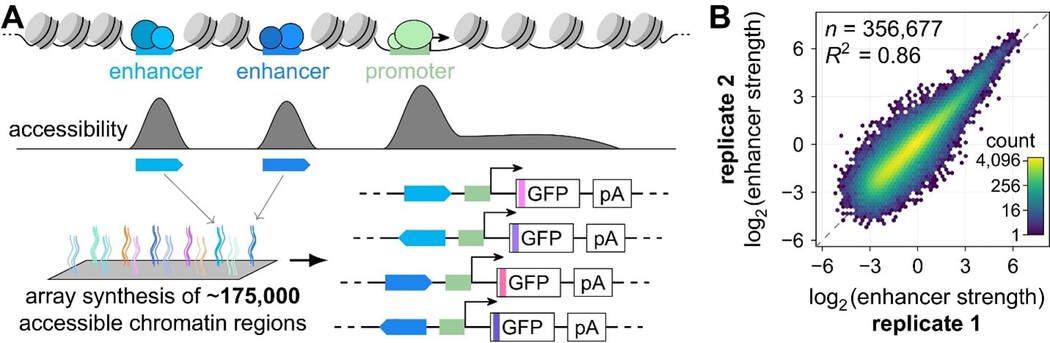
Figure 4: Enhancer strength can be measured with plant STARR-seq. A, Enhancer candidates were identified in accessibility data from Arabidopsis, tomato, maize and sorghum. The candidate sequences were array-synthesized and cloned into plant STARR-seq reporter constructs in the forward and reverse orientation. B, Enhancer strength was measured by plant STARR-seq in tobacco leaves and the correlation between results from two biological replicates is shown.
Apart from the genome-wide identification of cis-regulatory elements, Plant STARR-seq can also be used for a detailed characterization of individual elements. To understand how the condition-specific activity of plant enhancers is encoded in their DNA sequence, we used Plant STARR-seq to characterize and dissect three plant enhancers that possess light-responsive activity. Through saturation mutagenesis, we identified single-nucleotide mutations that strongly reduce the activity of the AB80, Cab‑1, and rbcS‑E9 enhancers. These mutations often cluster together in patches we term mutation-sensitive regions. We found cooperative interactions between these mutation-sensitive regions and shows that their spacing and orientation matters for light-responsive enhancer activity.
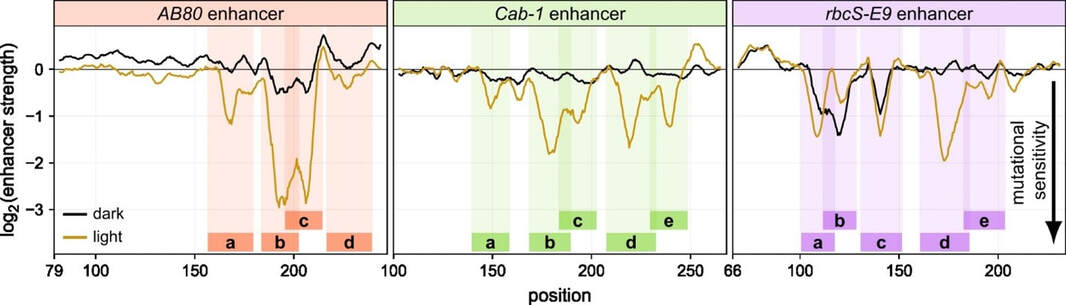
Figure 5: The AB80, Cab-1, and rbcS-E9 enhancers contain multiple mutation-sensitive regions. All possible single-nucleotide substitution, deletion, and insertion variants of the AB80, Cab‑1, and rbcS‑E9 enhancers were subjected to Plant STARR-seq in tobacco plants grown in normal light/dark cycles (light) or completely in the dark (dark) for two days prior to RNA extraction. Enhancer strength was normalized to the wild-type variant (log2 set to 0). A sliding average (window size = 6 bp) of the mean enhancer strength for all variants at a given position is shown. Mutational sensitivity is reflected by a reduction in enhancer strength (black arrow). Mutation-sensitive regions are indicated as colored rectangles.
The regulatory landscape of Arabidopsis thaliana roots at single-cell resolution
Mike Dorrity
Single-cell genomics provides a view of the state of each cell individually, allowing us to account for factors that confound typical bulk genomics experiments. These factors include cell type, cell cycle progression and developmental stage. With single cell measurements, each of these sources of heterogeneity in a typical biological sample can be deconvolved using the right tools to do so. As we profile single cells for molecular phenotypes beyond transcription, there is even greater potential to resolve individual cell states, but this resolution depends on our ability to leverage computational tools that integrate different types of data.
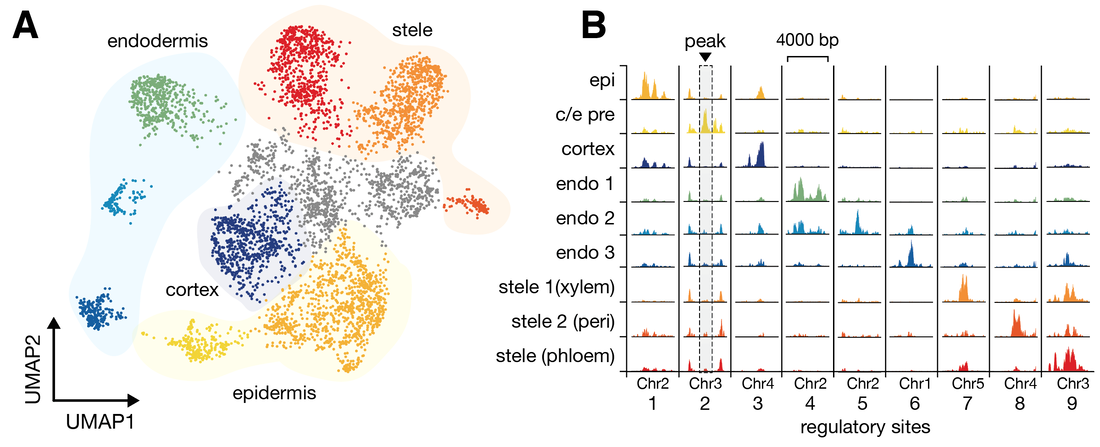
We used profiling of open chromatin by single cell ATAC-seq (scATAC) alongside previously generated transcriptional profiling data from single cell RNA-sequencing (scRNA) to discern cell states of the root of Arabidopsis thaliana, the continuously-developing tissue that is responsible for the acquisition of nutrients and water required for plant growth. These cell states can be visualized in a UMAP dimensionality reduction plot (Figure 1A). The power of scATAC-seq to identify cell type-specific accessible sites can be visualized simply by “pseudobulking” cells of each type and examining average cutcounts per site (Figure 1B).
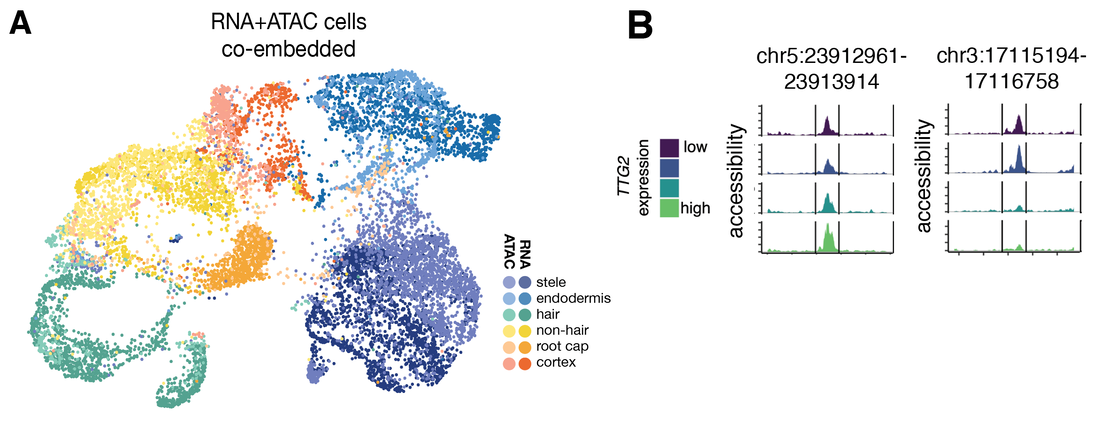
We combined these scATAC-seq data with previous root scRNA-seq data (Ryu et al. 2019 Plant Physiol 179, 1444) to link cell states in these two data types. Using dataset integration tools (Stuart 2019 Cell 177, 1888), we generated a co-embedding of root cells from both scATAC-seq and scRNA-seq sources (Figure 2A). Using this co-embedding, we were able to predict gene expression levels in cells from our scATAC-seq experiment. With these integrated data, we asked whether we could we link the expression level of transcription factors, the regulatory proteins responsible for switching genes on and off, to the accessible sites that “open” up in root epidermis cells. We found that transcription factors like TTG2, which has an epidermis-specific expression pattern, can be linked to individual accessible regions of the genome, providing a first step toward building stepwise models of gene regulatory programs that are deployed during development (Figure 2B).